Debug panel
Gaia Sky has a built-in debug information panel that provides a lot of good information on the current system and is hidden by default. You can bring it up with ctrl + d, or by ticking the “Show debug info” check box in the system tab of the preferences dialog. By default, the deubg panel is collapsed.

Collapsed debug panel
You can expand it with the + symbol to get additional information.
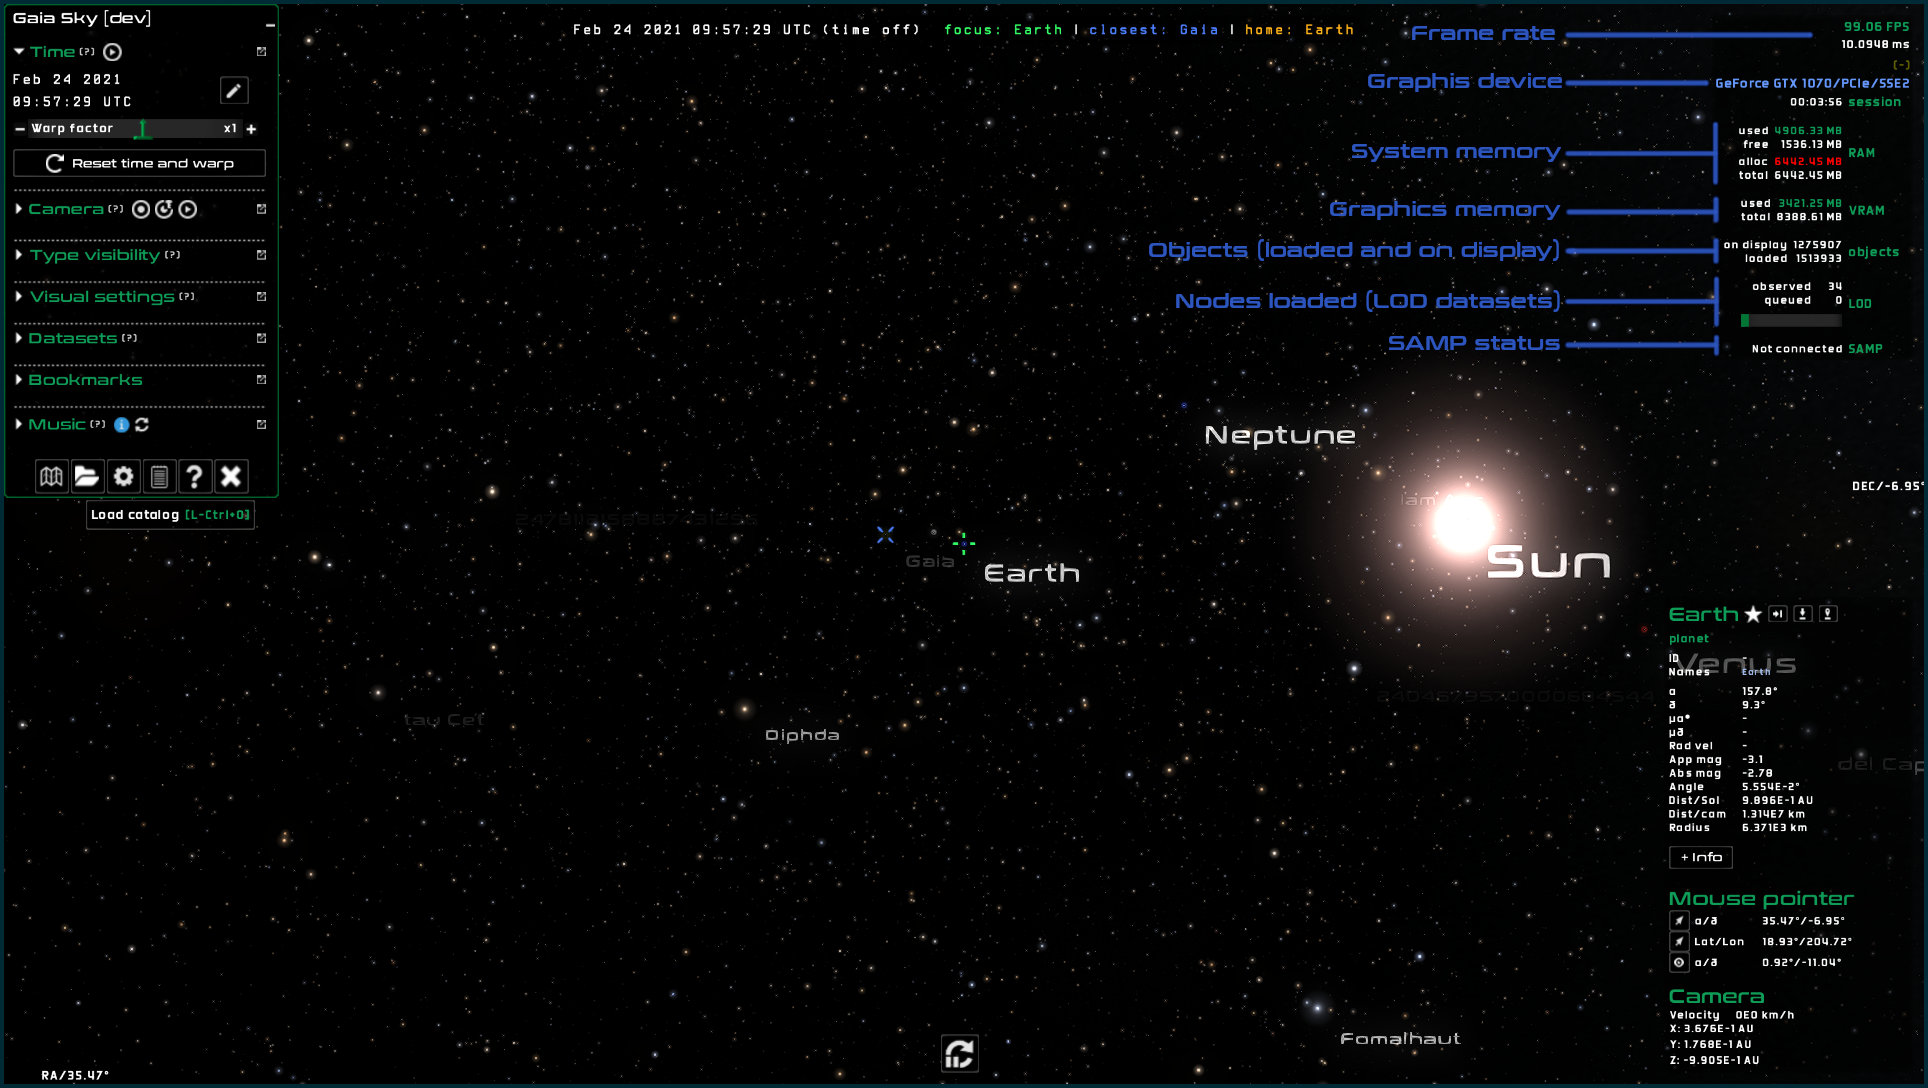
Expanded debug panel
As you can see, it contains information on the current graphics device, system and graphics memory, the amount of objects loaded and on display, the octree (if a LOD dataset is in use) or the SAMP status.
Additional debug information can be obtained in the system tab of the help dialog (? or h).