

System information#
Gaia Sky has a couple of built-in methods to get information on the system and graphics memory, the frame rate, the graphics device, the LOD status and much more. First, the system information panel offers a quick and easy way to access all sorts of system information while running Gaia Sky, in the main user interface. Second, the debug mode enables the logging of additional information to the system log, which can be helpful to analyze crashes or bugs.
Additionally, you can get an overview of the system (software version and build, Java version and vendor, hardware and operating system details, and OpenGL version and properties) using the help dialog.
System information panel#
Gaia Sky has a built-in debug information panel that provides information on the current system. This panel is hidden by default. You can bring it up with ctrl + d, or by ticking the Show debug info check box in the  System tab of the preferences dialog.
By default, the system information panel is collapsed.

Collapsed system information panel, showing the current frame rate (green) and the frame time (white). The small [+] icon to the bottom expands the panel.#
You can expand it with the [+] symbol to get additional information.
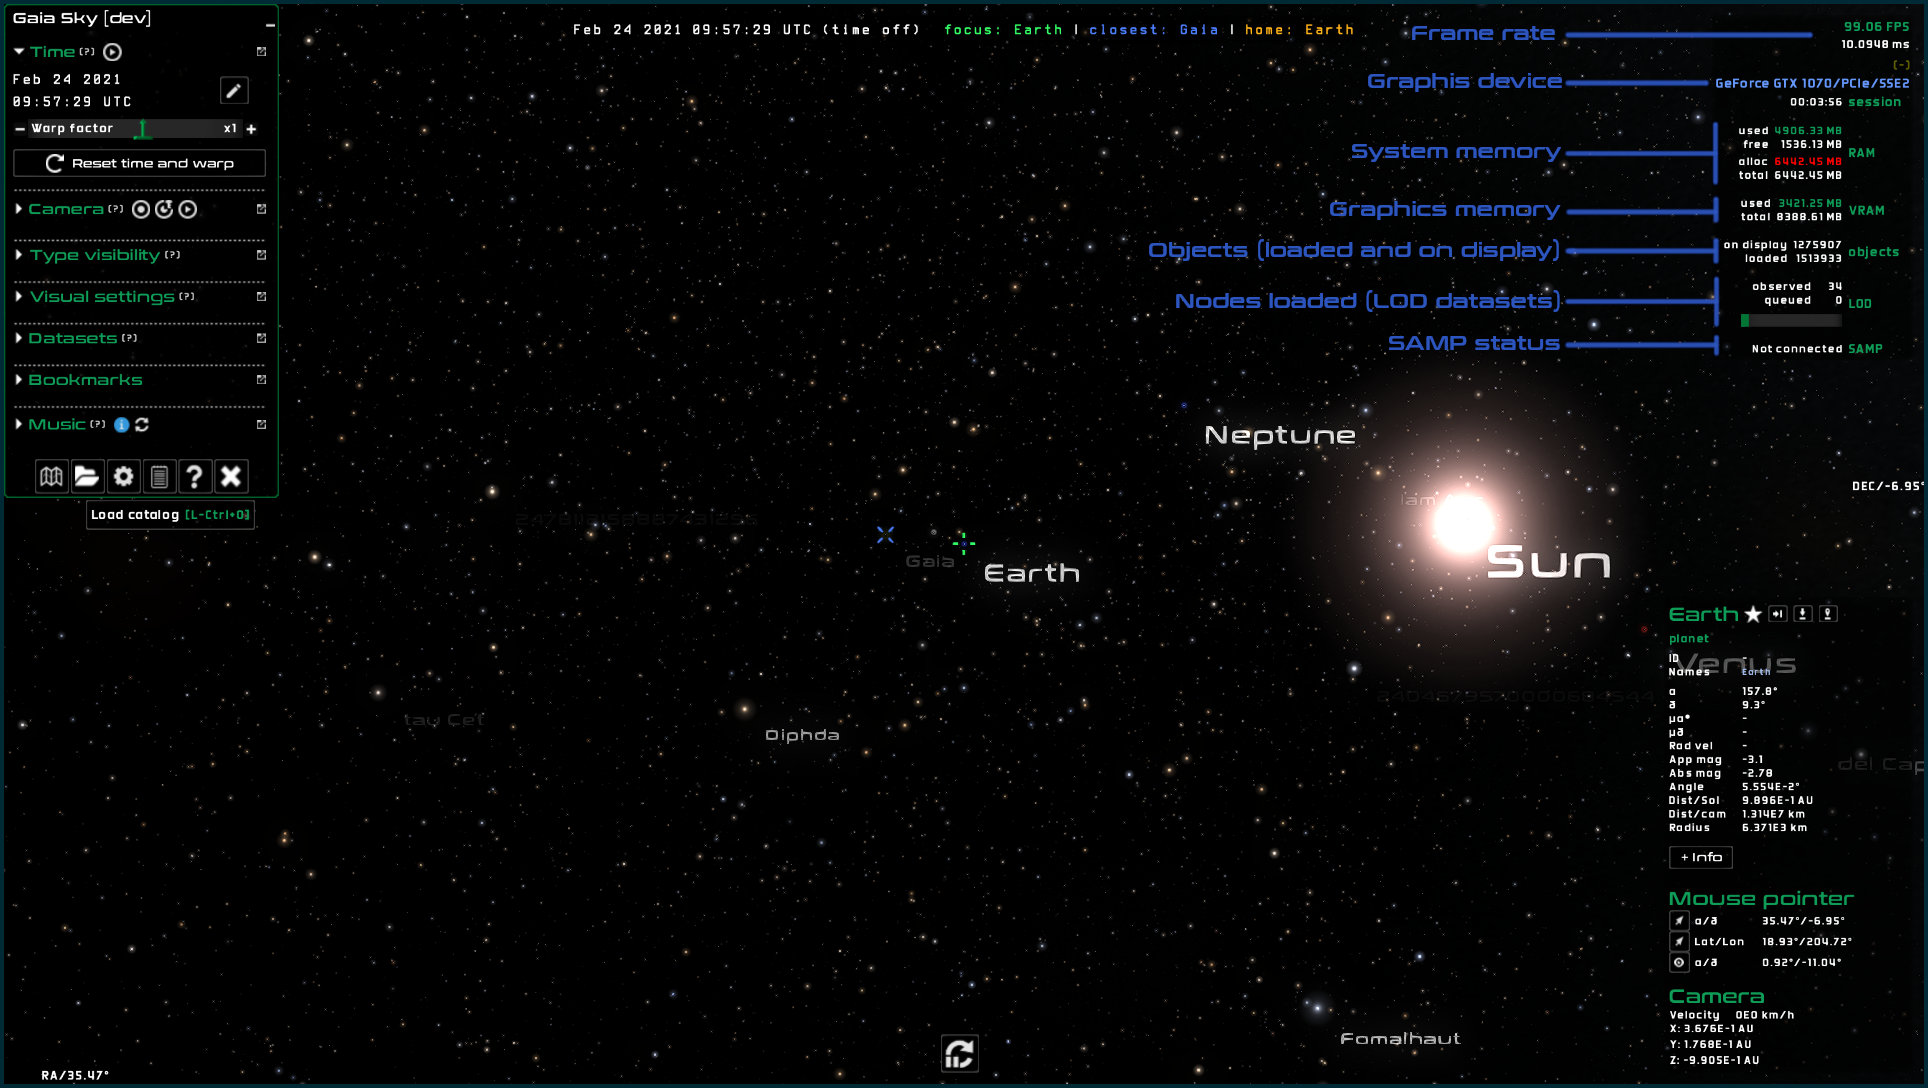
Expanded system information panel, showing the graphics device, system memory, graphics memory, loaded objects, LOD nodes and SAMP status, additionally to the frame rate and time.#
The panel contains information on the current graphics device, system and graphics memory, the amount of objects loaded and on display, the octree (if a LOD dataset is in use) or the SAMP status.
Additional debug information can be obtained in the system tab of the help dialog (? or h).
Object debug#
Danger
Only use the object debug window if you know what you are doing. You may break the internal state of Gaia Sky!
The Object Debug Window provides access to the internal components of objects in Gaia Sky. While it is a powerful tool, it can be risky to use if you’re not familiar with its workings. To open it, click the small blue alpha symbol (\(\alpha\)) at the bottom-left of the debug panel. It appears as follows:

The Object Debug Window allows you to inspect and modify the internal values of objects.#
This window lets you inspect and modify the internal components of all objects. At the top, you’ll find a search bar that allows you to select objects by name. Additionally, the object displayed in the debug window will change whenever the focus shifts in the scene.
Gaia Sky uses an Entity Component System (ECS), so objects are essentially collections of components. In the object debug window, each component is represented as a collapsible panel, listing its attributes. Some of these attributes—such as primitive types, strings, and boxed types—are editable. Modifying these values can have unintended consequences, so you should only make changes if you are fully aware of the effects.
Debug mode#
Gaia Sky includes a mode where more information is printed in the standard output (and the log files) to help locate and identify possible problems. This is called debug mode.
In order to run Gaia Sky in debug mode, you need to launch it from the command line (your terminal application of choice in Linux or macOS, PowerShell or cmd in Windows) using the -d or --debug flags.
On Linux or macOS, fire up your terminal, navigate to your Gaia Sky installation directory, and run:
./gaiasky --debug
On Windows, open PowerShell, navigate to your Gaia Sky installation directory, and run:
.\gaiasky.exe --debug
You will be able to see the log printed out in the terminal window. You can also recover the log files if you need to. More info in the logs section.